DBA handbook — Cosmos Optimizer step-by-step
Walk through every pane of the Cosmos Optimizer with a real production cluster. For each screen: what it shows, how to test it, what to expect, and how to troubleshoot when something is off.
§0 Prerequisites
Before opening the Optimizer, finish the setup guide. Without credentials, every metrics pane shows NO SOURCE and falls back to Local samples (only what NoSqlStudio itself queried).
- Follow Cosmos monitoring setup end-to-end: Service Principal, RBAC role assignment, Resource ID, Cloud Credentials. Cosmos monitoring setup.
- Verify with az login --service-principal and az monitor metrics list that the SP can read metrics for your Cosmos account.
- Open NoSqlStudio → connect to the Cosmos account → open Tools → Cosmos DB → Cosmos Optimizer (or Ctrl+Alt+Shift+O).
§1 5-minute smoke test — confirms everything is wired
Goal: in 5 minutes, confirm Azure Monitor is feeding real data to NoSqlStudio. If any step fails, jump to §3 Troubleshooting. §3 Troubleshooting.
- Connect to your Cosmos account in NoSqlStudio. Confirm you see the database tree in the sidebar.
- Open Cosmos Optimizer. The intro banner should show CONFIGURE DATA SOURCES button if credentials are missing, or pane content directly if they are saved.
- Go to RU Budget. The source-mode banner should read AZURE MONITOR — aggregate only in green within 2 seconds. Click Refresh. Within 1-2 minutes you should see non-zero Consumed (avg).
- Click each tab (Query Cost, Hot Partitions, Index Policy, Throughput Optimizer, Throttling RCA, Diagnostic Logs, Composite Index, PITR Restore, Migration Wizard). None should throw a red error.
- Open the DevTools console (F12) — should NOT contain ChainedTokenCredential authentication failed or monitor client is null.
§2 Per-pane walkthroughs
One section per pane. Each has: screenshot (when available), what it shows, step-by-step test, expected result on a busy production cluster, and troubleshooting notes for common issues.
RU Budget
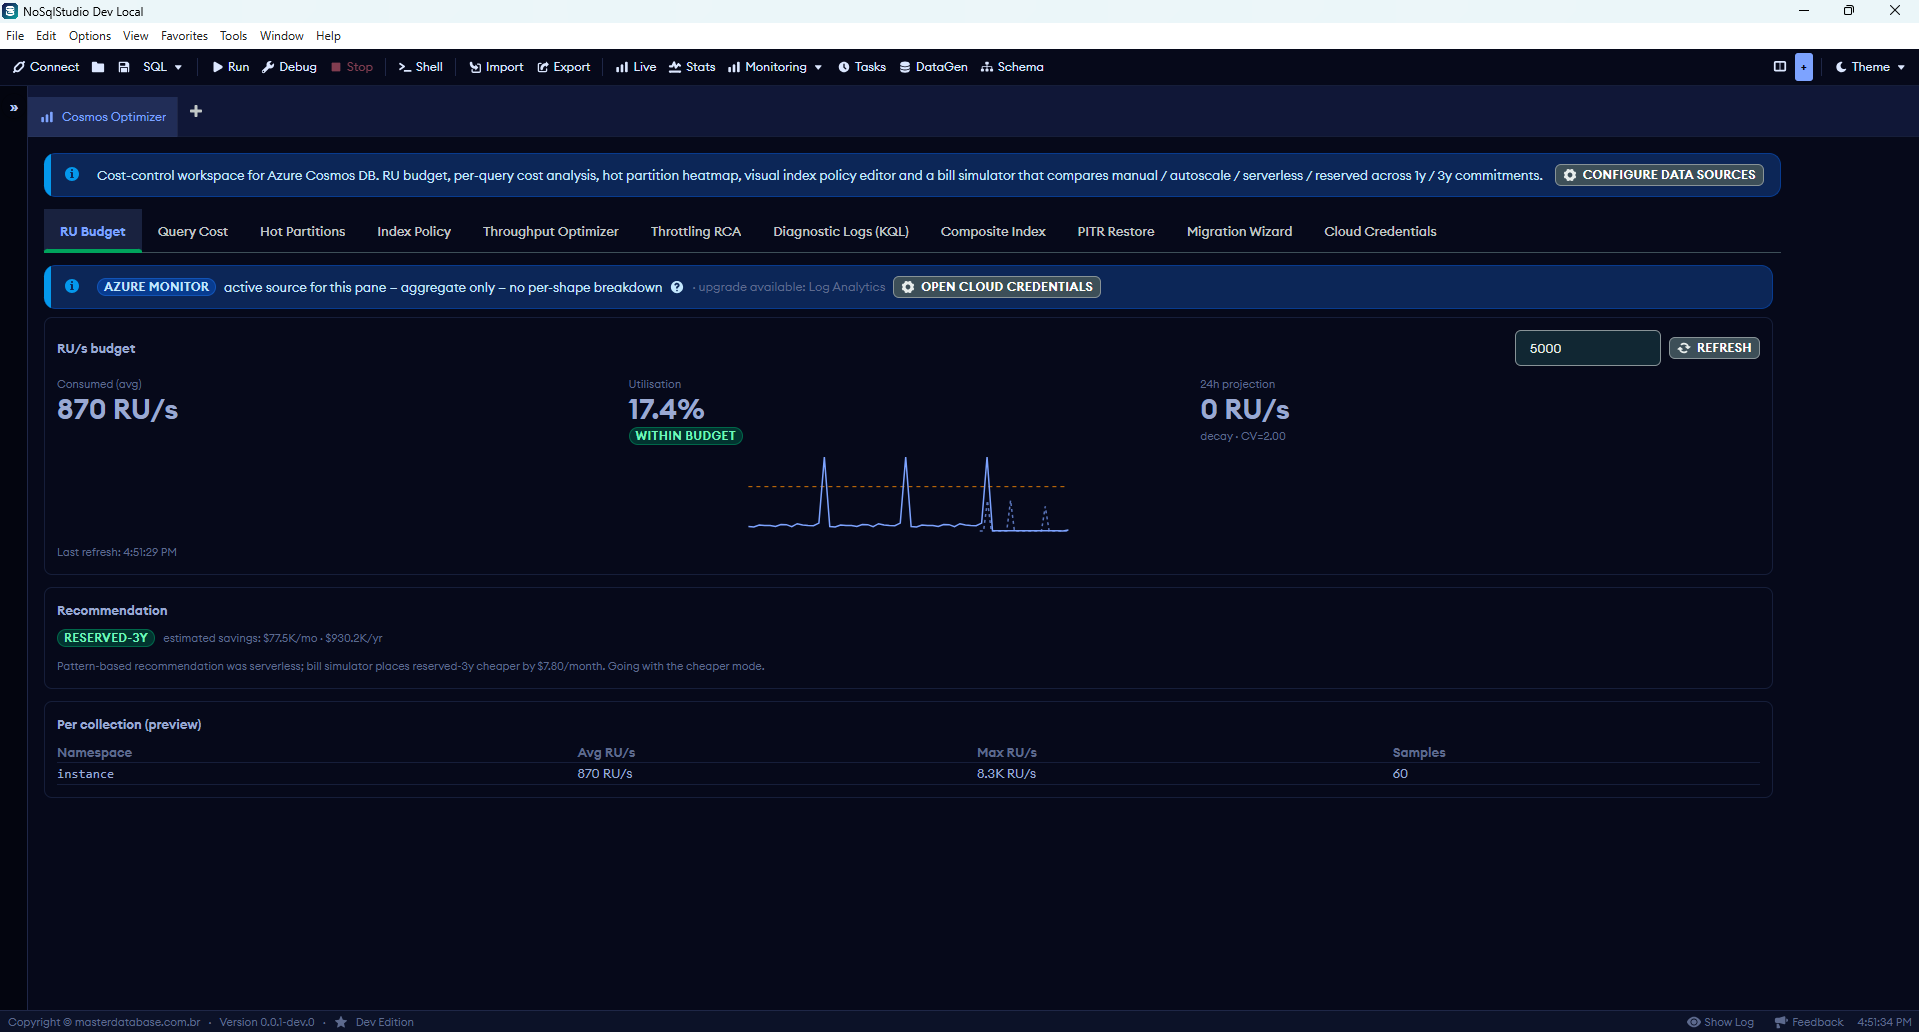
Live view of RU/s consumed by your Cosmos account vs the budget you set. Holt-Winters forecast for 24h. Recommendation card comparing manual / autoscale / serverless / reserved.
Test steps
- Set RU/s budget to your account's provisioned throughput (e.g. 5000 for a 5k RU/s database-level provisioning).
- Click Refresh.
- Observe Consumed (avg): should be non-zero on an active cluster. Compare against the value you see in the Azure Portal under Metrics → NormalizedRUConsumption.
- Check Utilisation badge color: green = under 65%, yellow = 65–85%, red = over 85%. Red means urgent scale-up consideration.
- Read the Recommendation card. Common outputs: RESERVED-3Y for steady workloads, AUTOSCALE for spiky ones, SERVERLESS for low-volume bursts.
- Scroll to Per collection (preview). With Azure Monitor only, you see a single instance row aggregating everything — per namespace requires Log Analytics (PAID tier).
Query Cost Inspector
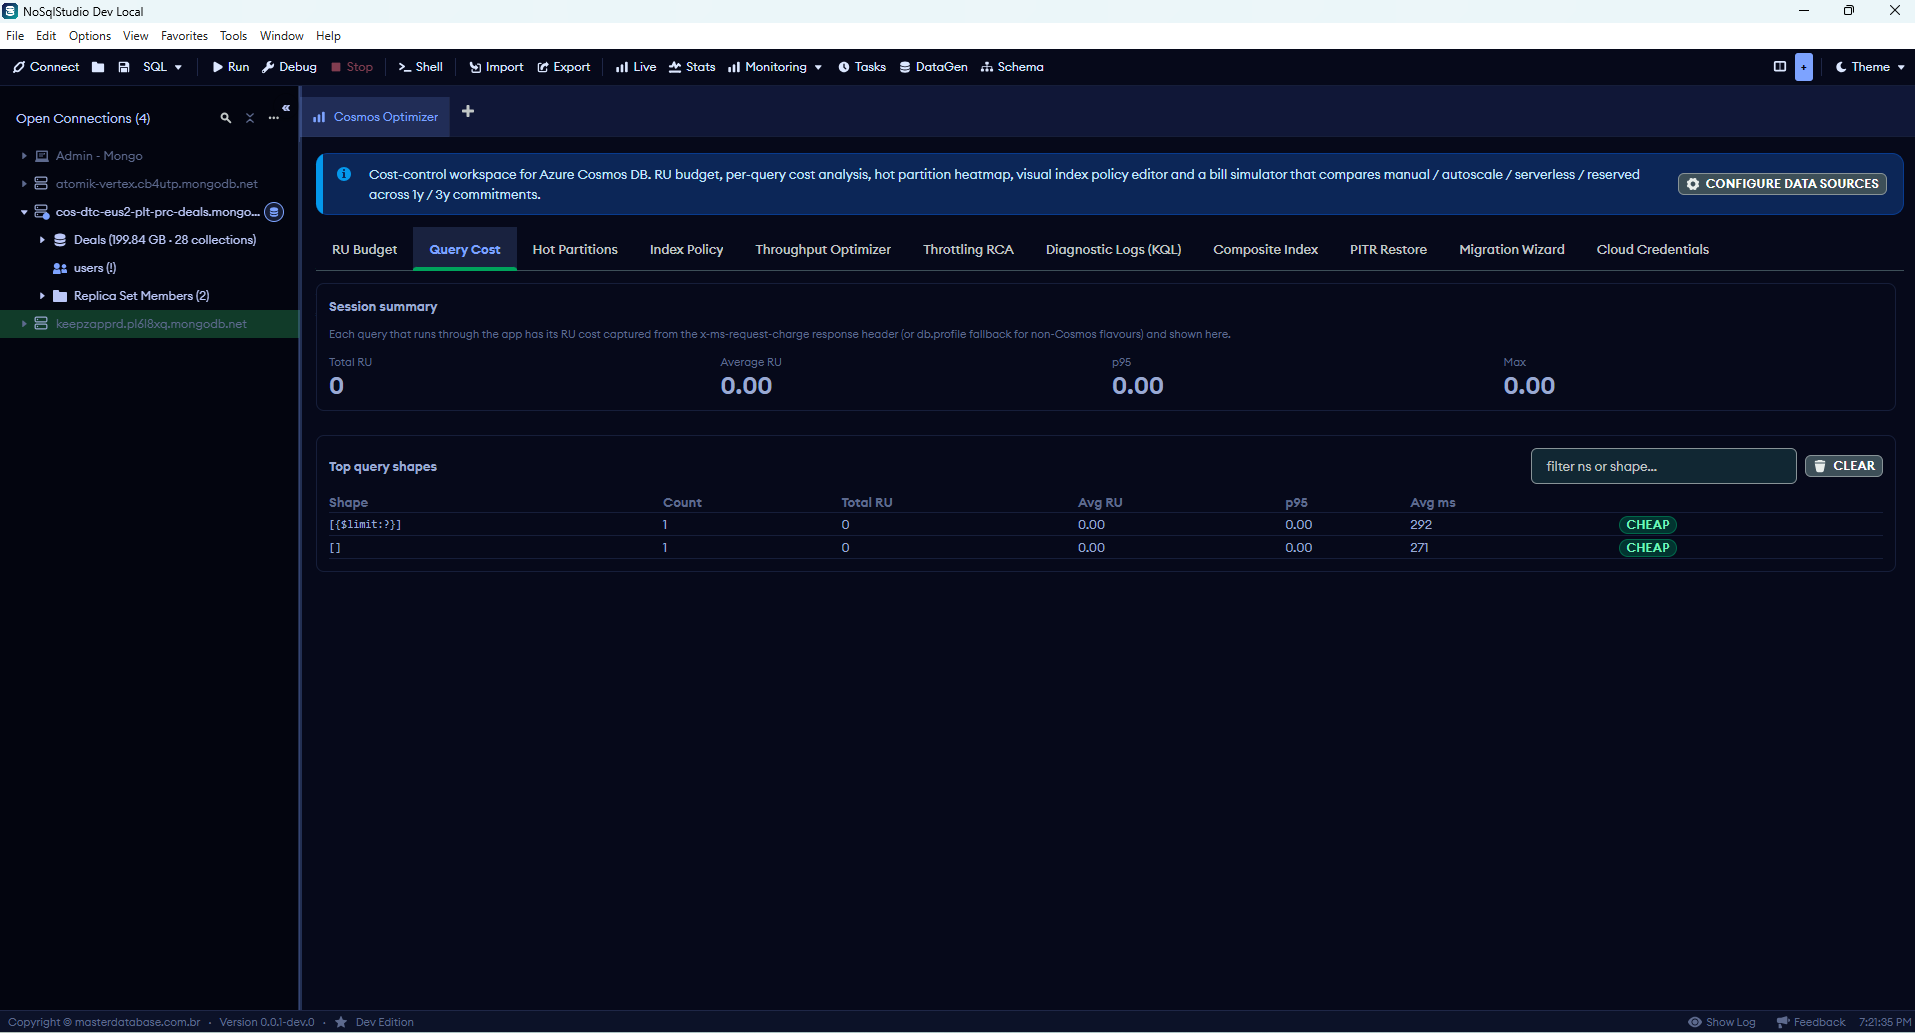
Captures the x-ms-request-charge response header from every query you run through NoSqlStudio. Zero Azure API calls — pure client-side instrumentation, always available.
Test steps
- Open a Shell or Query tab against the Cosmos collection.
- cosmosSite.dbaHandbook.queryCost.step2
- Return to the Query Cost tab. Top query shapes should populate with the shape, total RU, average RU, p95, max, and count.
- Run the same shape 5+ times to populate the count and p95 properly.
- Use the filter input top-right to narrow to ns or shape substring.
Hot Partition Detector
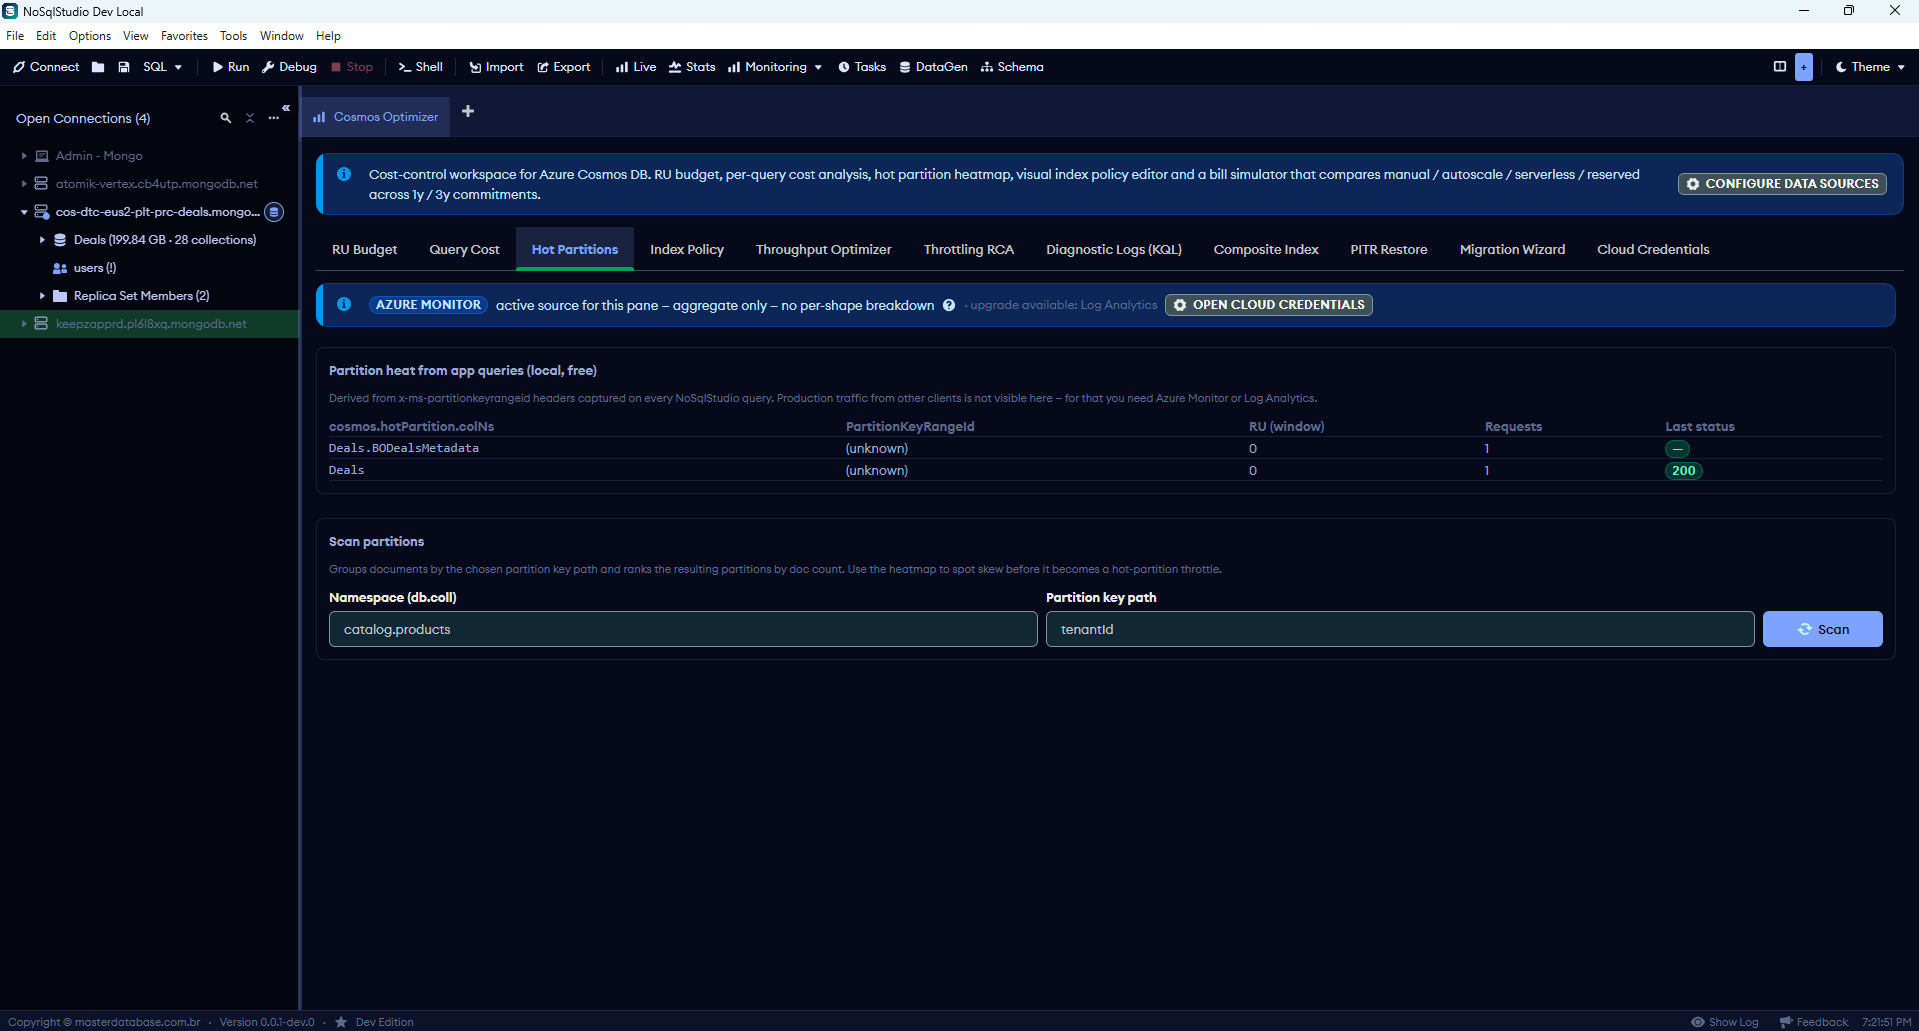
Active probe that groups documents by your partition key and ranks the resulting partitions by doc count. Spots skew (one partition holding 40%+ of docs) before it becomes a 429 throttle storm.
Test steps
- Fill Namespace: db.coll format, e.g. catalog.products.
- Fill Partition key path: the field name you used as shardKey when creating the collection, e.g. tenantId.
- Click Scan. This runs a $group aggregation on Cosmos — costs RU proportional to collection size. On a 200 GB collection expect 100-500 RU.
- Read the spread badge in the top-right: green = even distribution, yellow = moderate skew, red = severe skew (top partition > 40% of docs).
- Use the heatmap to spot specific hot partitions. Hover any cell for the exact key value + doc count.
Visual Index Policy Editor
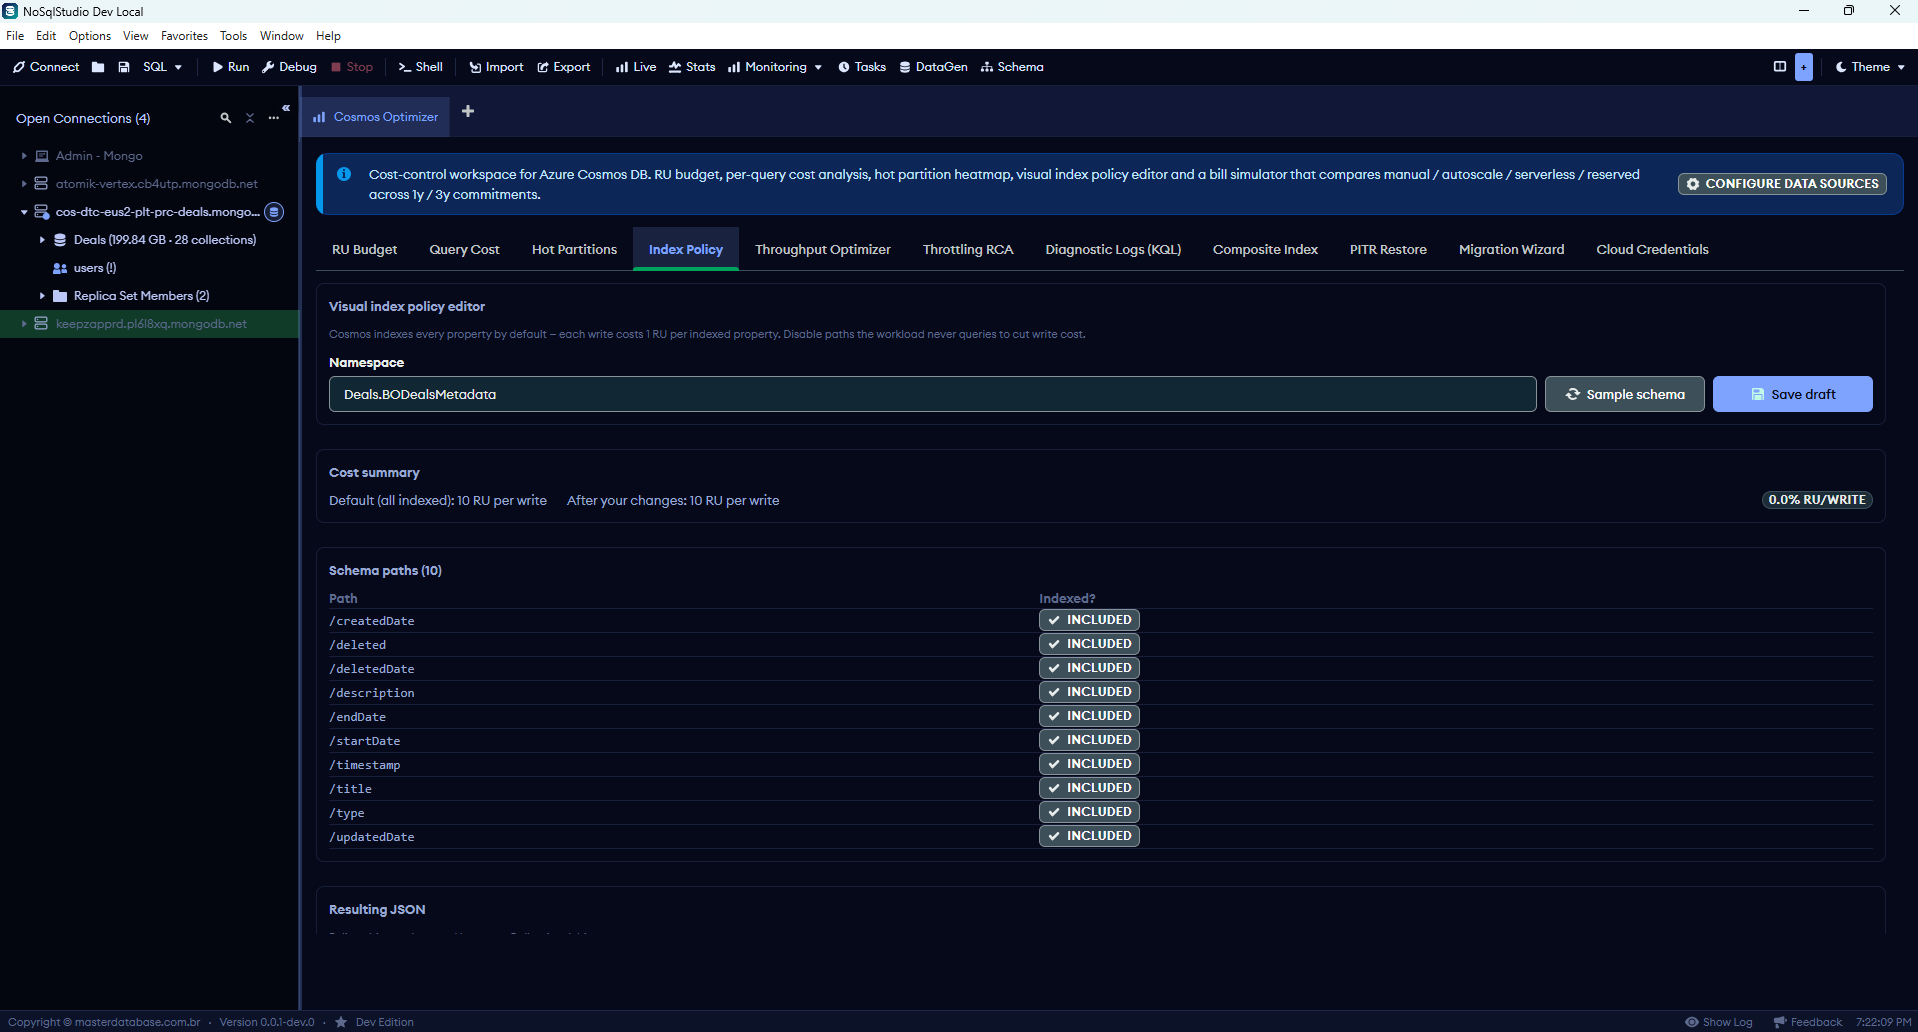
Cosmos indexes every property by default — each write costs 1 RU per indexed property. Excluding never-queried paths can cut write RU consumption 30-70% on document-heavy collections.
Test steps
- Fill Namespace, e.g. catalog.products.
- Click Sample schema. NoSqlStudio reads 100 docs and builds a tree of all field paths.
- Uncheck any field that NEVER appears in a WHERE / filter clause — think imageBase64, fullText, metadata.audit.*, etc.
- Click Save draft. JSON preview updates with the proposed indexingPolicy.
- cosmosSite.dbaHandbook.indexPolicy.step5
Throughput Optimizer + Bill Simulator
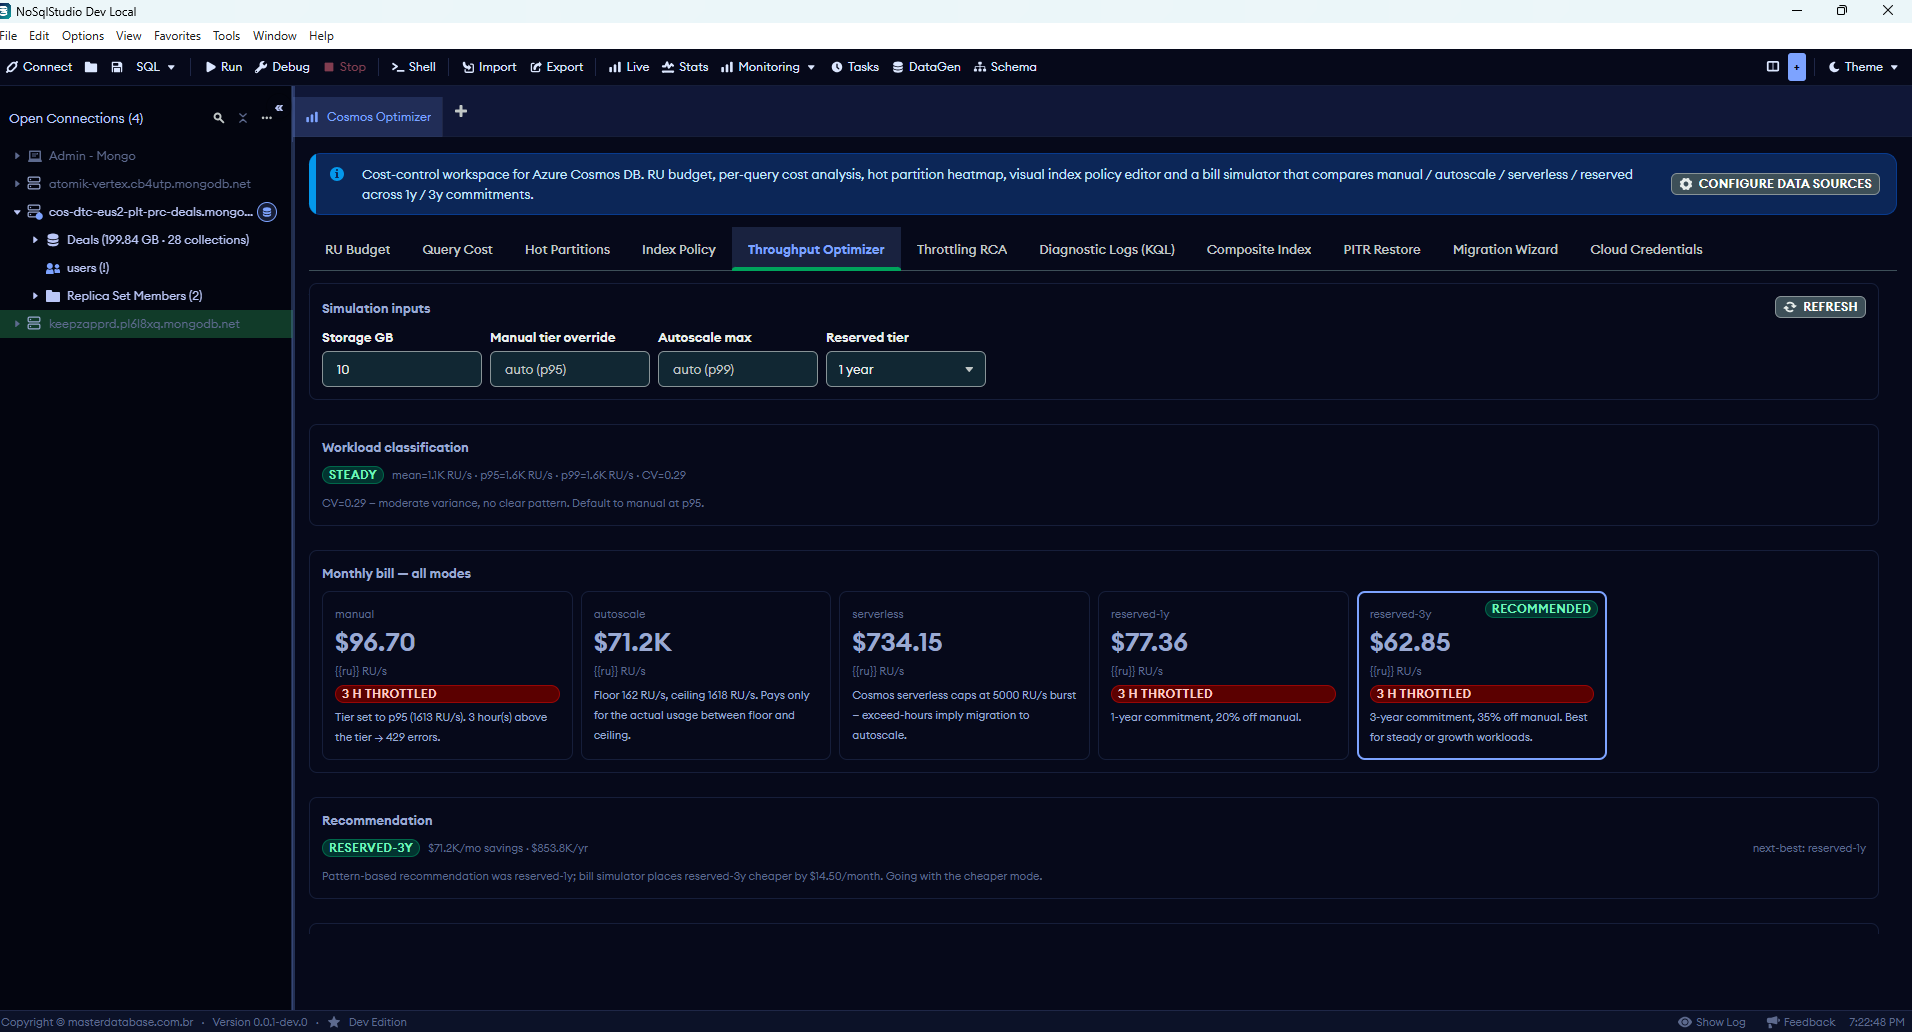
Classifies your workload (STEADY / SPIKY / CYCLIC / RAMP) from the last 15 min of metrics, then simulates monthly bill across the 5 Cosmos billing modes side-by-side. Reserved Capacity quote at the bottom.
Test steps
- Click Refresh at top-right.
- Read the Workload classification card. Common outputs: STEADY (low variance, CV < 0.4), SPIKY (CV > 0.8, recommend autoscale), CYCLIC (predictable daily peaks, recommend reserved with scheduled scale).
- Compare the 5 Monthly bill cards. The cheapest with RECOMMENDED badge is the algorithm's pick.
- Look for THROTTLED red banner on the manual card: indicates your current p95 exceeds the simulated tier and would cause 429s.
- Scroll to Reserved capacity quote: concrete RU/s number to commit to + monthly savings vs manual.
Throttling RCA
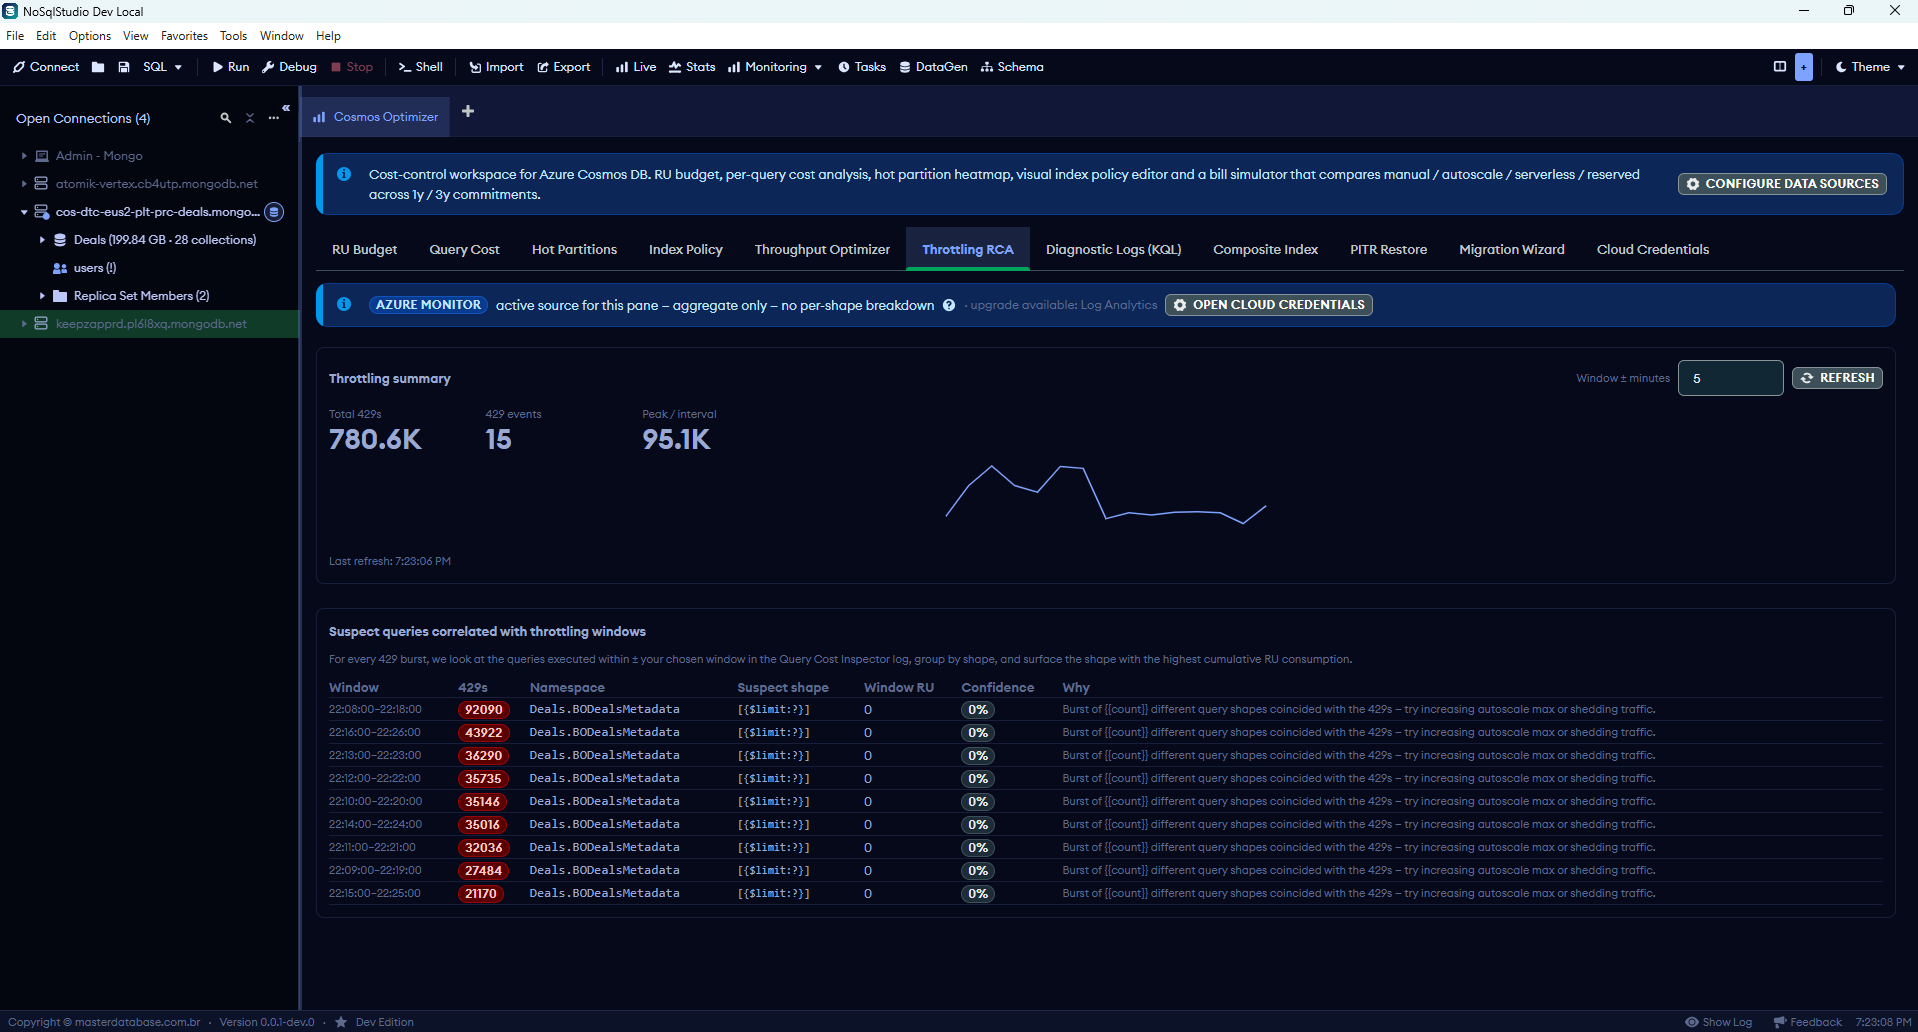
Counts 429 (rate-limited) responses in the recent window via Azure Monitor, then correlates each burst with queries captured in the Query Cost ring buffer. Surfaces the query shape with highest cumulative RU during the 429 window — the likely culprit.
Test steps
- Click Refresh. Read Total 429s, 429 events, and Peak / interval.
- Set the Window ± minutes input (default 5). Lower it for tighter correlation, raise it if no queries fell in the window.
- Scroll to Suspect queries. Each row = one 429 burst with the most expensive query shape that ran ± window minutes from the burst, with a confidence score (0-1).
- If empty: open the Query Cost Inspector tab and run traffic. Without query captures, RCA has nothing to correlate.
Diagnostic Logs (KQL templates)
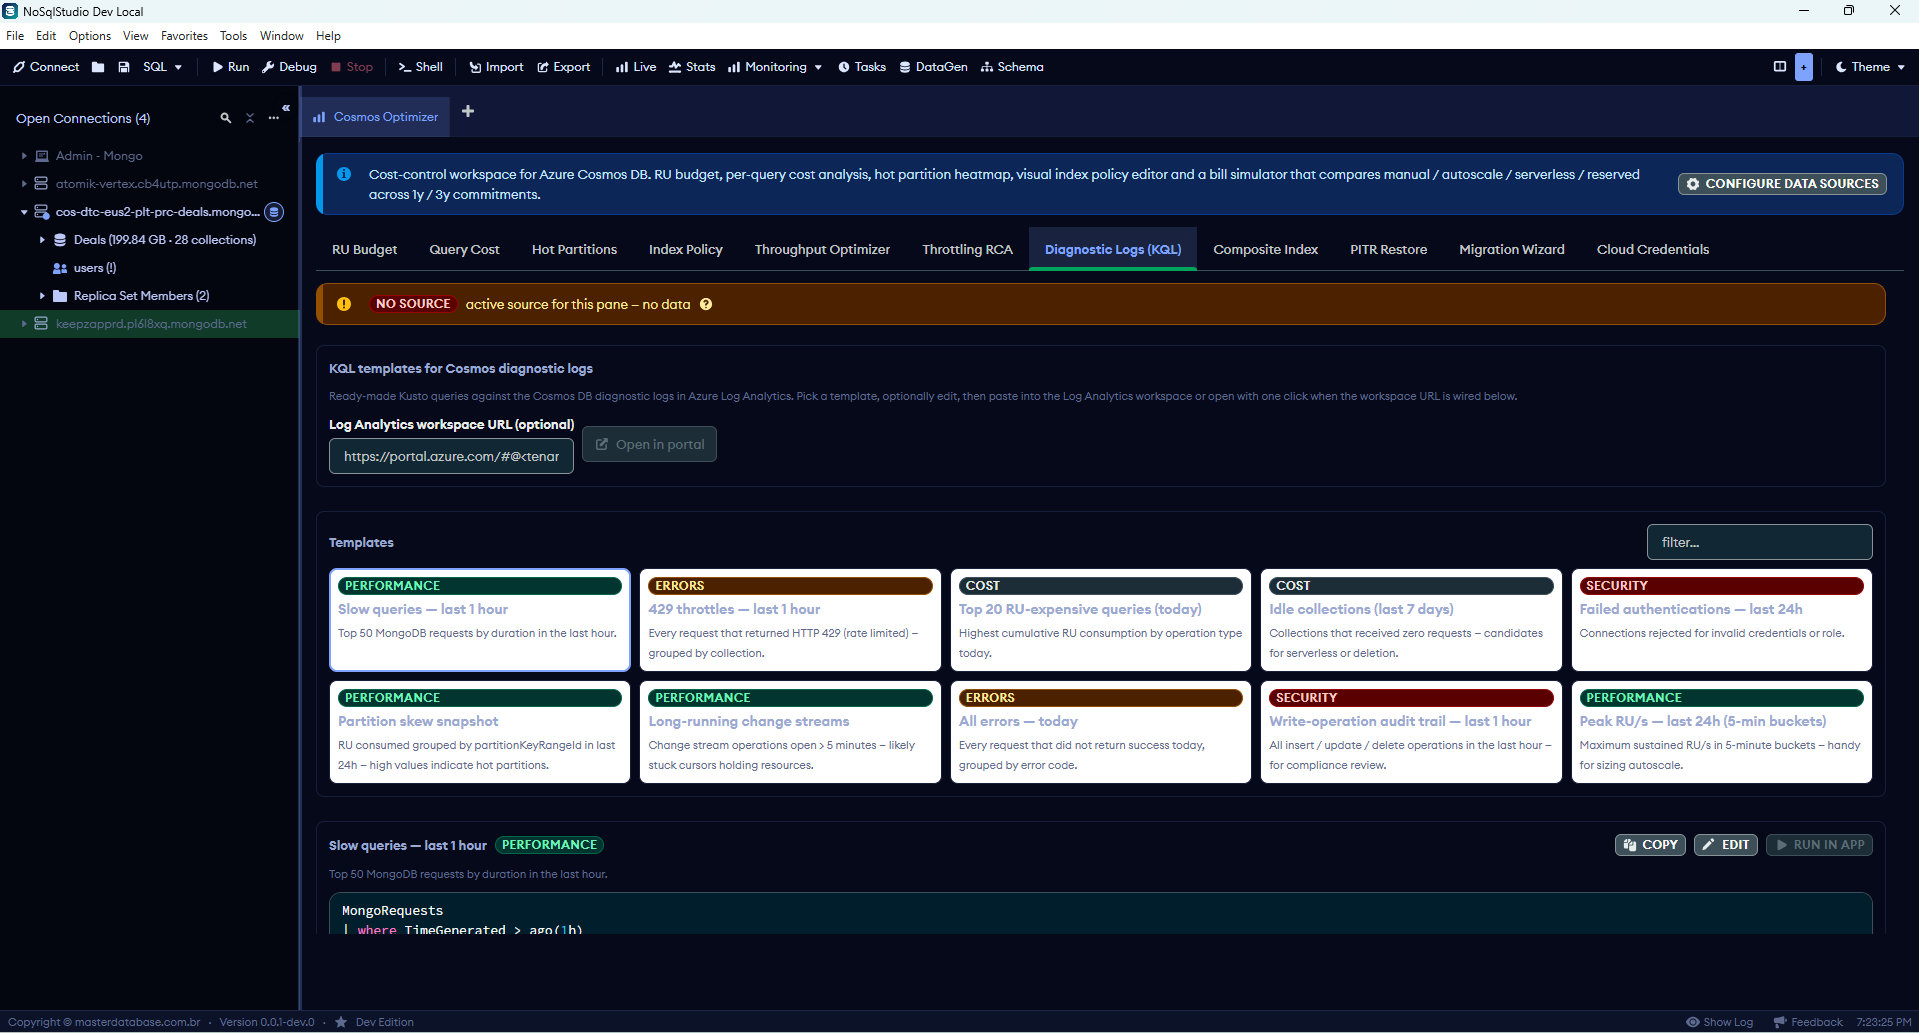
10 ready-made Kusto queries against the Cosmos Diagnostic Logs in your Log Analytics workspace. Requires the PAID tier (Diagnostic Settings enabled, Log Analytics workspace ID configured).
Test steps
- Verify the AZURE MONITOR banner shows upgrade available: Log Analytics. If you haven't plugged in the workspace ID, this pane shows NO SOURCE and the Run in app button is disabled.
- Click any template card (e.g. Slow queries — last 1 hour) to load its KQL into the editor.
- Click Edit to tweak the KQL inline (e.g. change ago(1h) to ago(24h)).
- Click Run in app. Results table renders below within 2-5 seconds.
- For long-form analysis, click Open in portal to deep-link the query into the Azure Portal KQL editor.
Composite Index Recommender
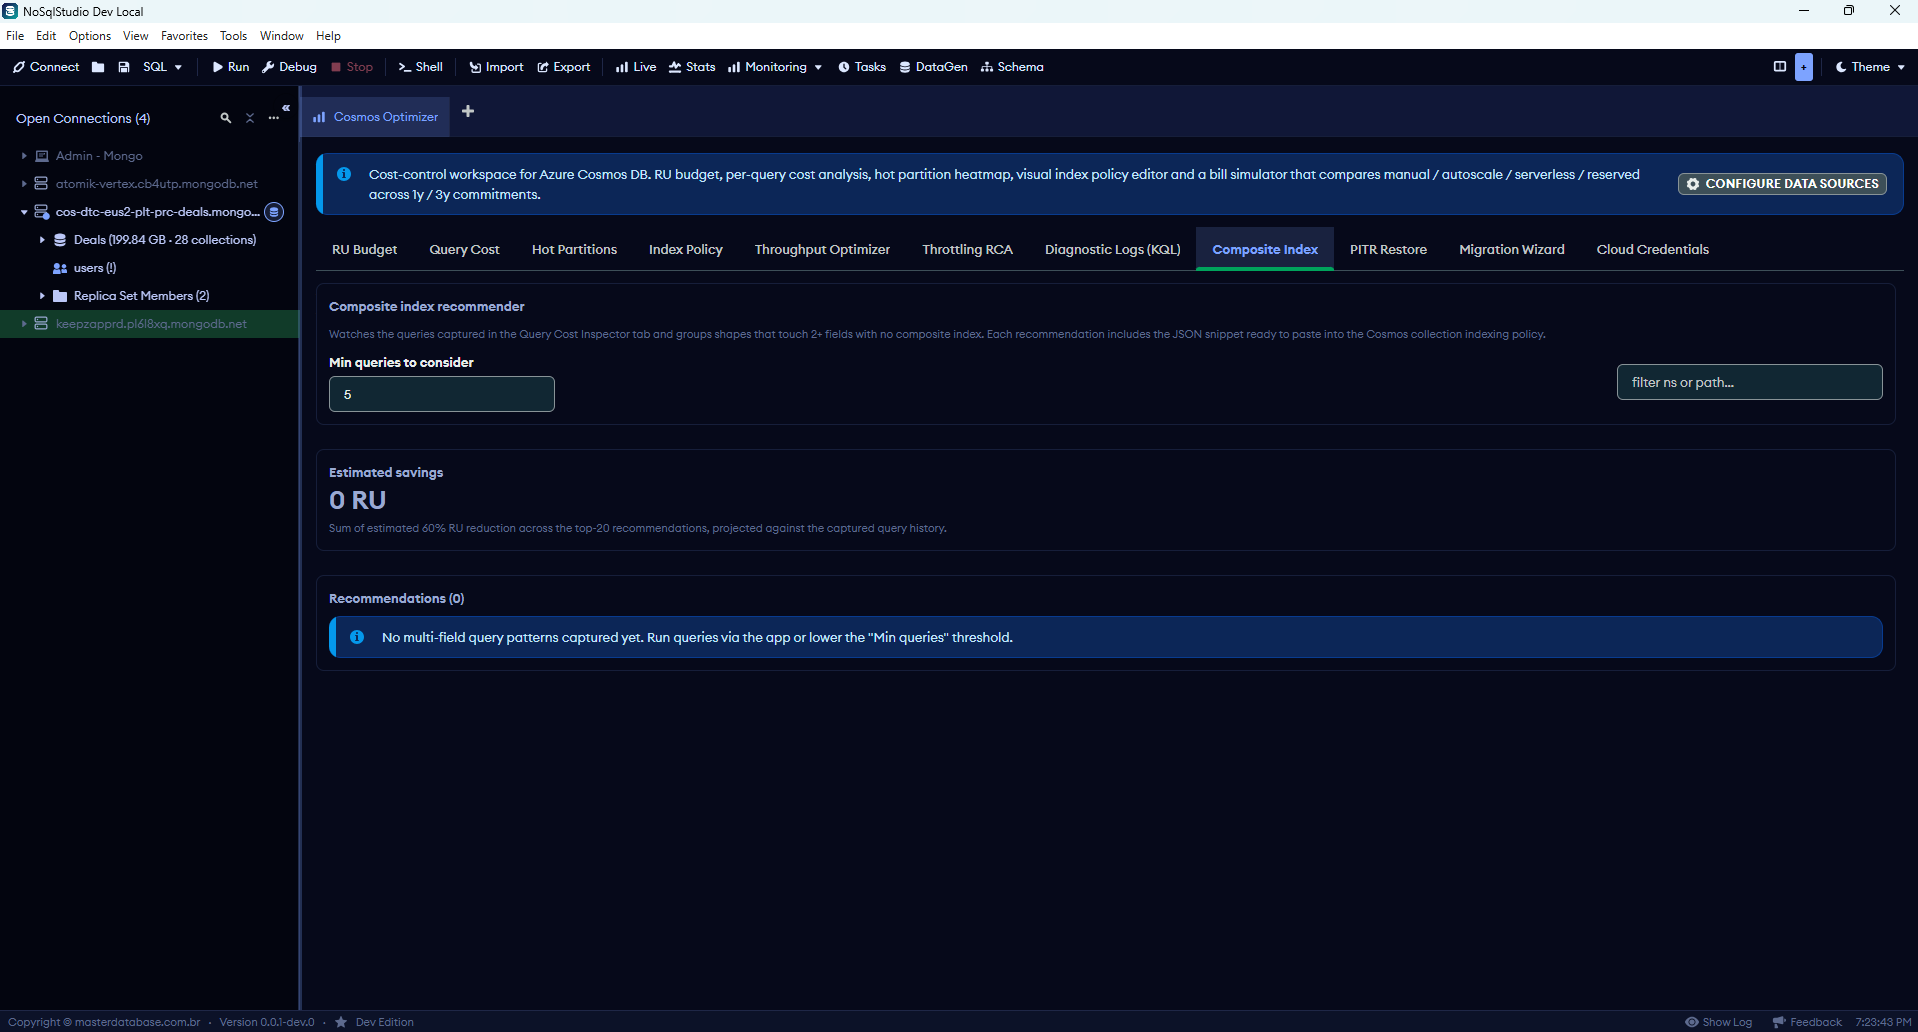
Watches the Query Cost ring buffer, identifies query shapes touching 2+ fields without a corresponding composite index, projects ~60% RU savings, emits the JSON snippet to paste into Cosmos's indexingPolicy.
Test steps
- Set Min queries to consider = 5 (default). Threshold for considering a shape worth recommending.
- cosmosSite.dbaHandbook.compositeIndex.step2
- Return here. The Recommendations list fills with shape + projected RU saving + JSON snippet.
- Click Copy JSON on any recommendation, paste into your Cosmos collection's indexingPolicy via collMod.
Point-in-Time Restore
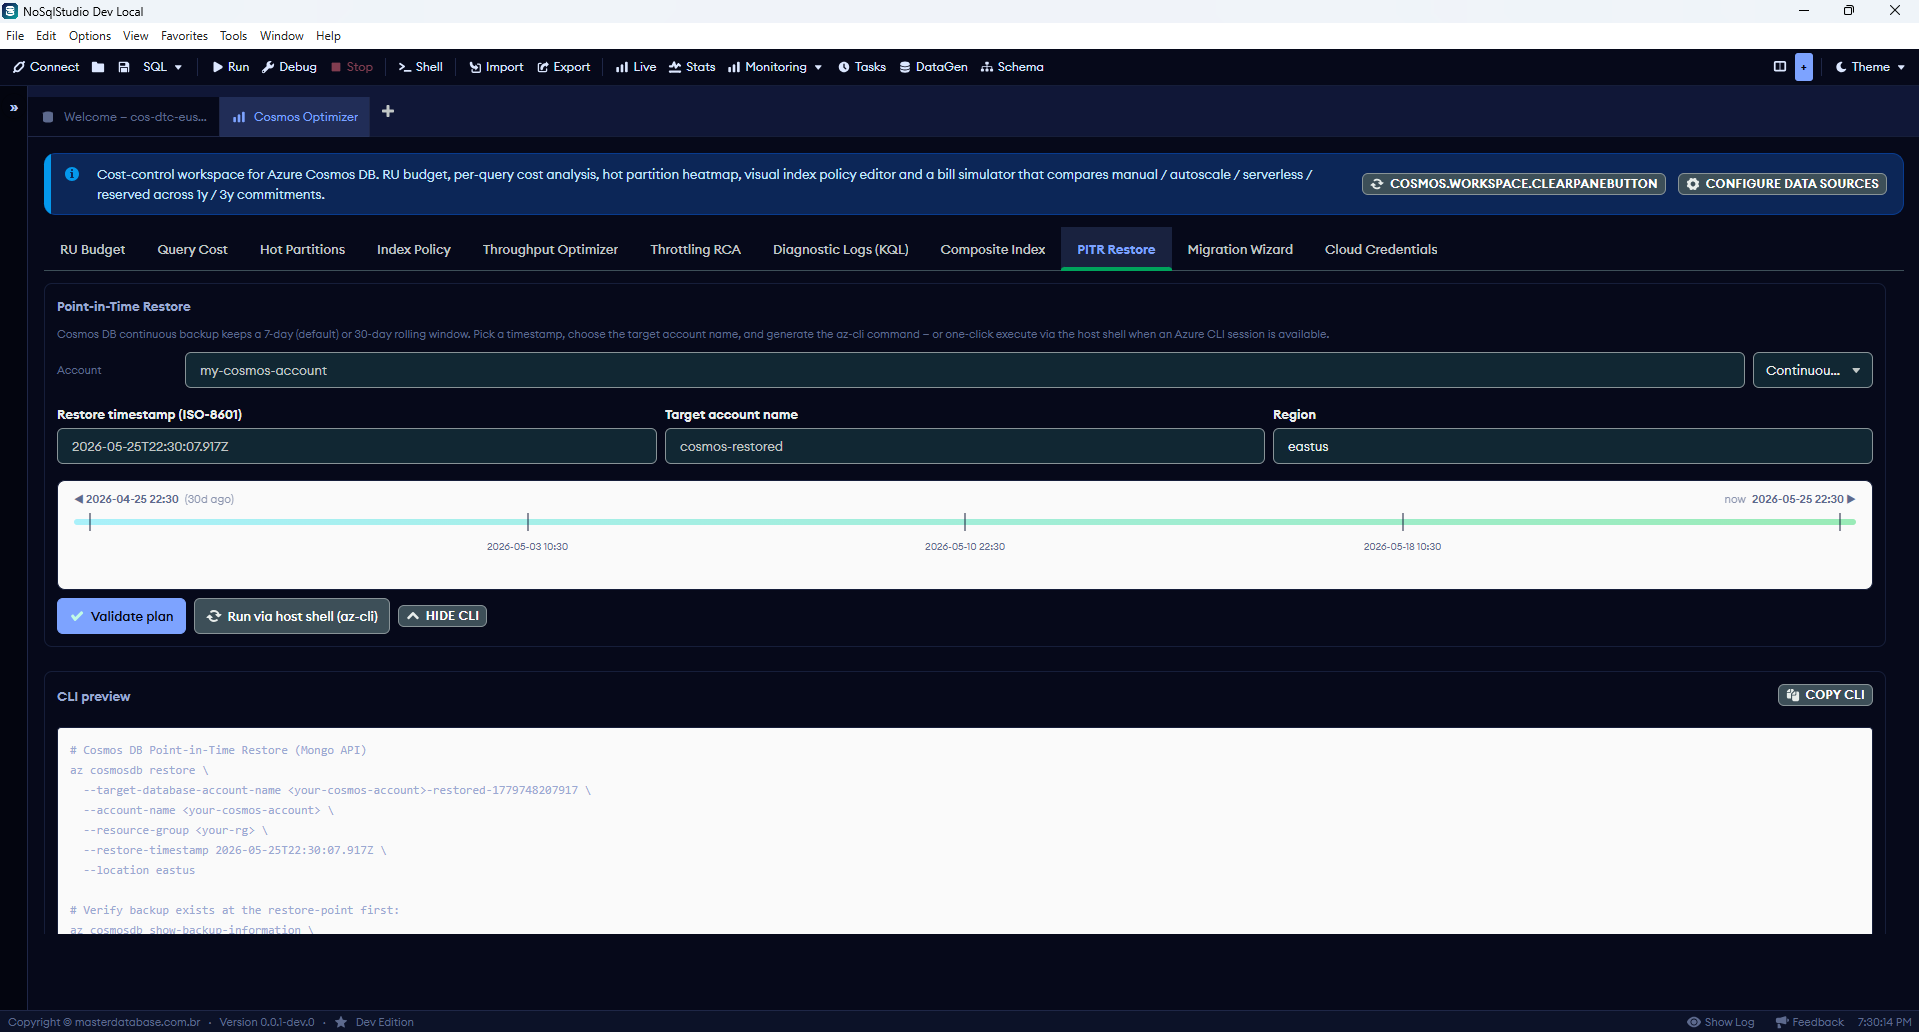
Disaster-recovery wizard. Picks a point in the Cosmos continuous-backup window (7 or 30 days depending on configured policy), generates the az cosmosdb restore CLI command, optionally executes it via the host shell.
Test steps
- Fill Account (the Cosmos account name).
- Set the Restore timestamp via slider or ISO-8601 input. Default: now minus 1 hour.
- Fill Target account name (must be new — cannot overwrite source) and Region.
- Click Validate plan. NoSqlStudio runs az cosmosdb show-backup-information to confirm a backup exists at that timestamp. Returns green check or red error.
- Click Run via host shell (az-cli) when ready. Restore takes 30-90 minutes for typical collections.
Migration Wizard Atlas ↔ Cosmos
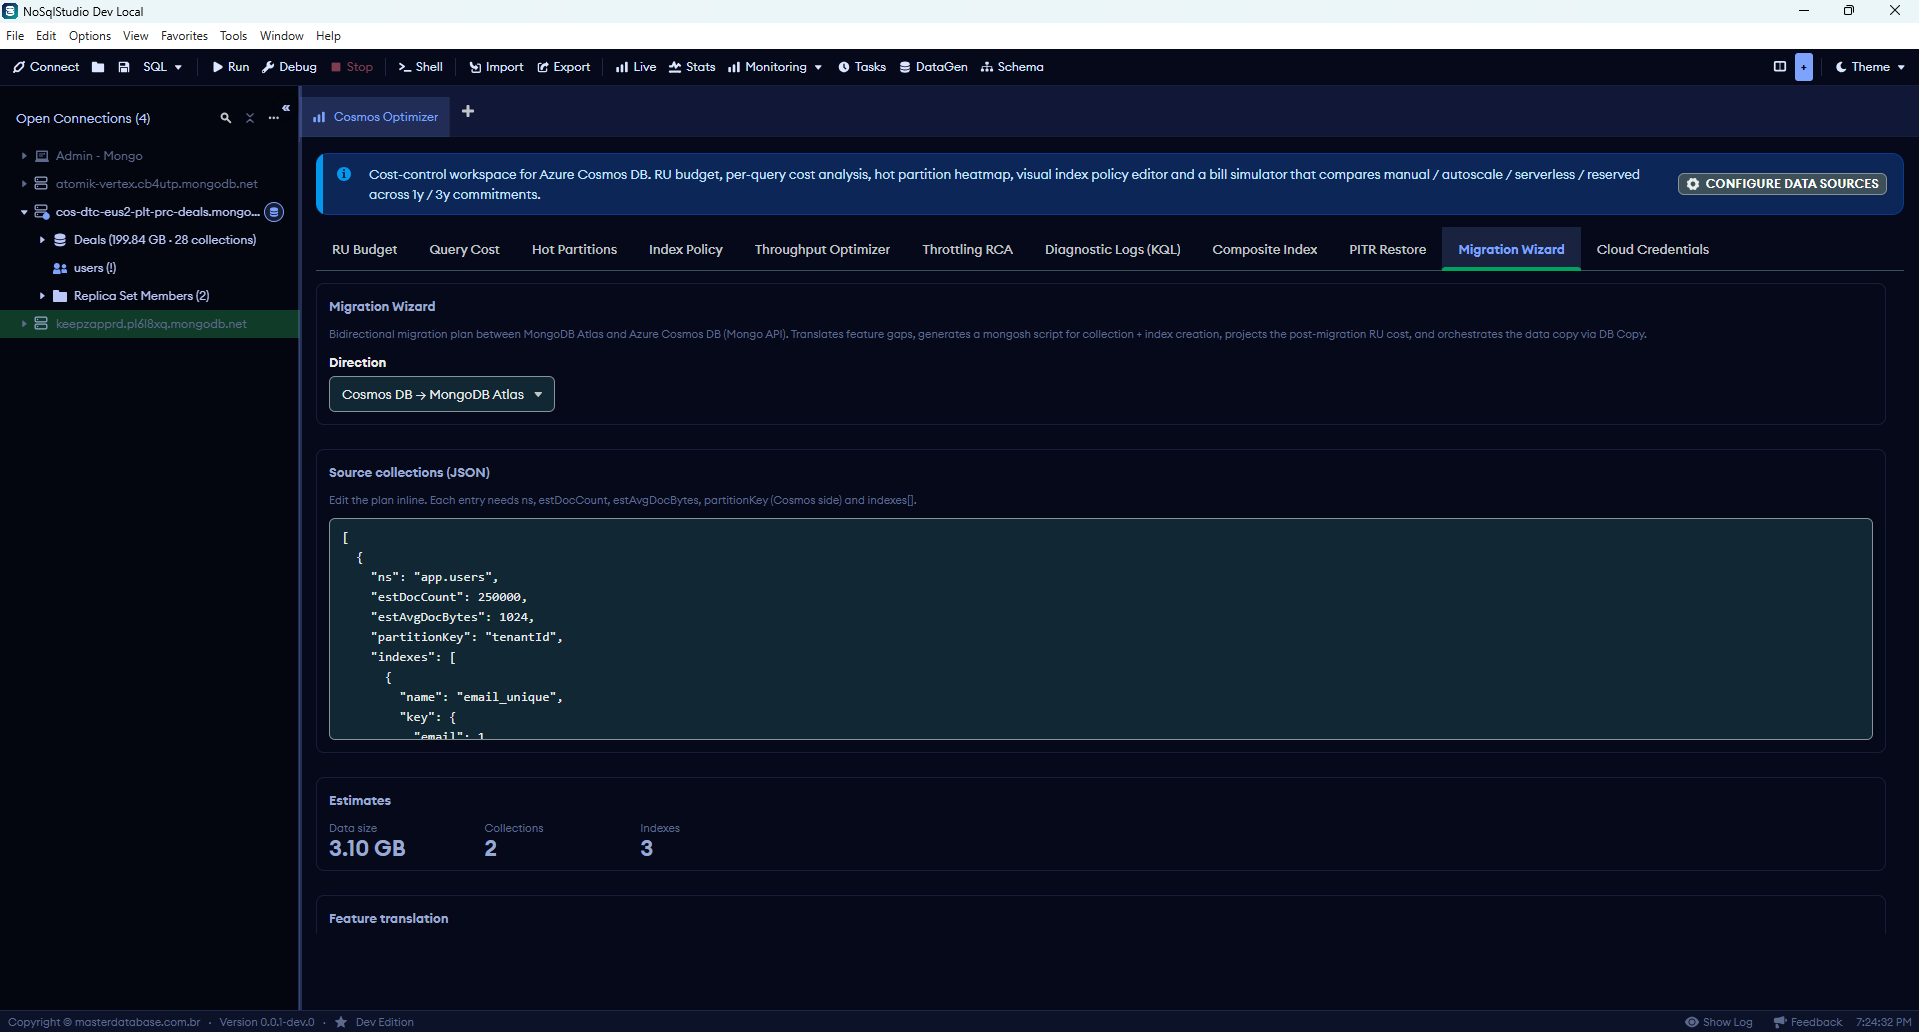
Bidirectional migration assistant. Picks source + target (Atlas → Cosmos or Cosmos → Atlas), shows translation matrix (features that become unsupported), projects monthly bill on the destination, generates the mongosh script.
Test steps
- Choose Source and Target: Atlas → Cosmos or vice-versa.
- Read the Translation matrix: features that don't survive the move (e.g. Atlas Search → Cosmos: works via NoSqlStudio multi-DB engines locally, not natively; Cosmos PITR → Atlas: replaced by Atlas cluster snapshots).
- Check Bill projection: estimated monthly cost on the target based on your current workload.
- Click Generate script. Outputs a mongosh script with insertMany batches and progress reporting.
- For real migration, dry-run on a test collection first (Cosmos charges write RU for inserts during migration!).
Cloud Credentials
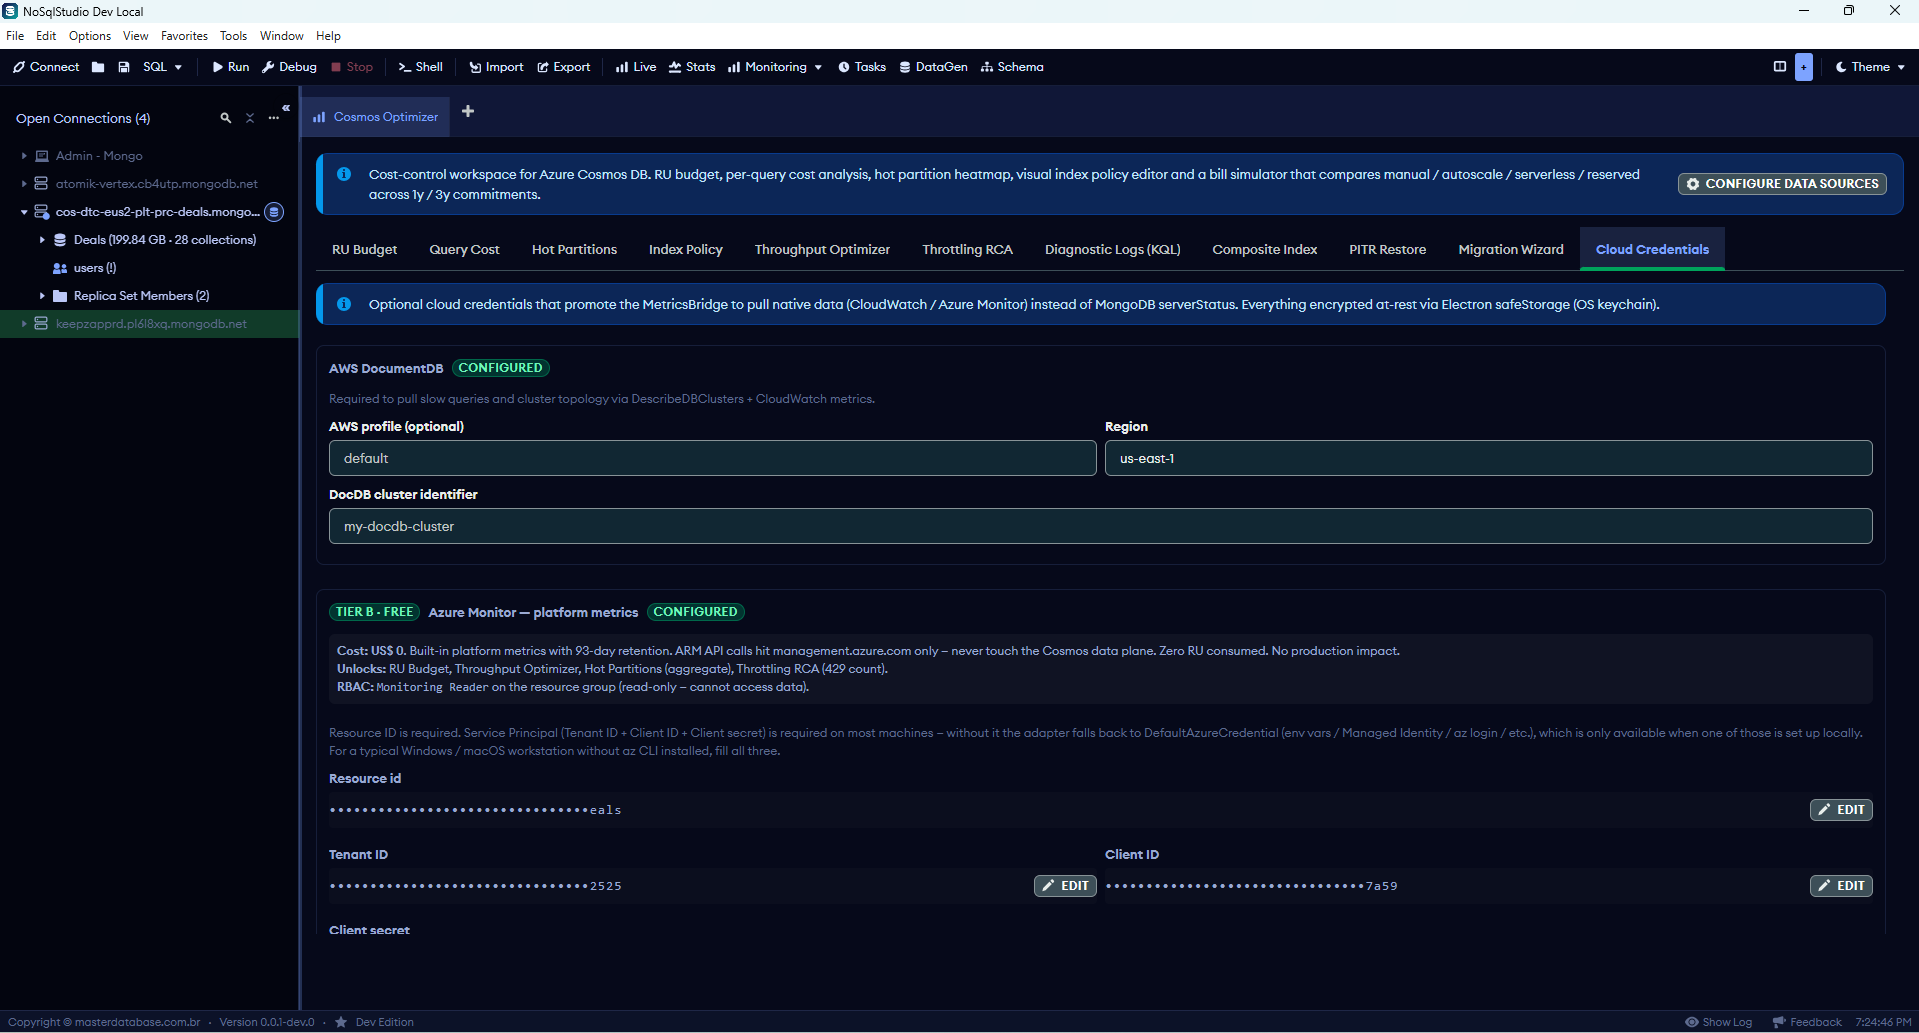
The control panel for what data sources feed every other pane. Three tiers: TIER C local (always on), TIER B Azure Monitor (FREE), TIER A Log Analytics (PAID).
Test steps
- Confirm the TIER B card shows CONFIGURED badge if you saved credentials.
- Sensitive fields (Resource ID, Tenant ID, Client ID, Client Secret, Workspace ID) appear masked as •••••••XXXX with an Edit button. Click Edit to reveal + change, then Mask to hide again.
- After Save: source-mode banner on every metrics pane flips to AZURE MONITOR within < 100 ms (via internal event), or up to 15 s (via poll fallback).
- Clear button (red) wipes credentials for this connection from disk + removes the bridge — everything reverts to NO SOURCE / Local samples.
§3 Troubleshooting matrix
| Symptom | Likely cause | Fix |
|---|---|---|
| NO SOURCE banner on RU Budget | Bridge not registered for this connection (renderer reload after credential save). | Open Cloud Credentials, click Save again. Lazy-register fires automatically on workspace mount in normal operation; force it via re-save when needed. |
| Banner green AZURE MONITOR but 0 RU/s | Auth chain failed silently (DefaultAzureCredential fallback) OR metric mapping bug. | Open DevTools (F12). Look for [azure-cosmos-adapter] logs. If you see ChainedTokenCredential failed: Client Secret is empty in Cloud Credentials, fill it. If you see metrics.list 401/403: SP lacks Monitoring Reader role. |
| Cloud Credentials Save toast green, but RU Budget still shows NO SOURCE after reload | Adapter SDK packages (@azure/arm-monitor, @azure/monitor-query) missing in node_modules. | Verify with node -e "require('@azure/arm-monitor')". If missing, run npm install --no-save @azure/arm-monitor @azure/monitor-query in the Compass repo (declared as optionalDependencies so npm sometimes skips them). |
| Cannot find module 'semver/preload' error at build time | Node 24 × semver 6.x mismatch in hadron-build / @mongodb-js/devtools-github-repo. | Create shim: node_modules/semver/preload.js with module.exports = require('./semver.js'). Or downgrade to Node 22.21.1 (the version Compass workflows test against). |
| Diagnostic Logs (KQL) shows NO SOURCE | Log Analytics workspace ID not configured (PAID tier unwired). | Decide: do you need per-shape KQL? If yes, enable Diagnostic Settings on Cosmos → stream to Log Analytics, paste the workspace GUID into Cloud Credentials. If no, accept that this pane is locked — Throttling RCA and RU Budget still work via Azure Monitor. |
| Query Cost / Composite Index empty | No queries run through NoSqlStudio yet (or all queries were via mongosh outside the app). | Run actual queries against your collection inside NoSqlStudio (Shell or Query tab). The cost capture hook lives on NoSqlStudio's DataService — it only sees what passes through. |
| Autoscale card shows nonsense like $41.9K/mo | Known bug in the bill simulator's autoscale calculation. | Other 4 cards (manual / serverless / reserved-1y / reserved-3y) are accurate. Ignore the autoscale number — fix planned for next release. |
| All panes scroll cut off mid-content | LeafyGreen <Tab> doesn't propagate height — was a layout bug before May 25 2026. | Update to latest NoSqlStudio build — fix is in scrollStyles with explicit maxHeight: calc(100vh - 320px). |
| Hot Partitions scan returns 16500: TooManyRequests | Aggregation throttled because cluster lacks RU headroom right now. | Temporarily bump RU/s, run scan, scale back. OR schedule the scan for off-peak window. |
| Throttling RCA "Suspect queries" empty despite high 429 count | Traffic comes from app servers / other clients, not NoSqlStudio. | Either replay known-bad queries in NoSqlStudio shell to populate the ring buffer, OR upgrade to Log Analytics (PAID) for full per-shape correlation via KQL. |